How to Calculate Churn Rate SaaS for Growth Insights
SaaS companies lose over $136 billion every year to churn. For some, that’s 20% to 40% of total revenue. But the real damage runs deeper. Churn distorts retention data, clouds your growth story, and hides the warning signs. To fix this, teams must learn how to calculate churn rate SaaS the right way.
To calculate churn rate, divide lost customers by the starting customers in a specific time period. When teams misread churn, they make poor decisions, inflate LTV, distort CAC, and miss early signs of retention problems.
This guide breaks down churn math across every SaaS role, from founders to RevOps to product teams. You’ll learn how to measure churn the right way, catch early warning signs, and turn insights into real growth actions.
What Is Churn In SaaS And How Does It Work?
Churn in SaaS means customers stop using your software or cancel their subscription within a given time frame. That drop could be in users, revenue, or both. Most SaaS teams measure churn monthly or yearly, depending on how they bill customers. It helps track retention and the true health of your user base.
This metric might sound like regular customer loss, but churn is sharper than that. General attrition happens naturally over time. You might see it in industries like retail or events. But churn in SaaS is more direct. It reflects active decisions to cancel or stop paying, which hurts recurring income fast.
Churn matters more in subscription-based models because the entire business depends on customers staying over time. You spend money to acquire each customer. If they leave too soon, you lose the chance to recover that cost. That loss also affects your recurring revenue streams like MRR and ARR.
A small change in churn rate can lead to major shifts in growth. It lowers your lifetime value (LTV), hurts cash flow, and slows expansion. Higher churn usually points to weak onboarding, poor product fit, or missed customer needs. That’s why tracking churn early gives your team a head start on fixing the leaks.
Churn isn’t just a number. It’s a mirror that shows what’s working and what’s failing inside your business.
Types of Churn SaaS Teams Need to Track
Not all churn works the same way. Each type reveals something different about why customers or money disappear. When SaaS teams pick the wrong churn type, they chase false signals and delay the fixes that actually matter. The right one points directly to what’s breaking and how to solve it faster.
Here’s a breakdown of the key churn types and when to use them:
| Churn Type | Definition | Example | Best Used By |
| Customer Churn | The number of customers who cancel or stop using the product in a set period. | 10 users out of 100 cancel by month’s end. | Support, success, and retention teams |
| Revenue Churn | The amount of recurring revenue lost from cancellations or downgrades. | $2,000 MRR lost from users who cancel or switch to lower plans. | Finance and leadership teams |
| Logo Churn | Total accounts lost, regardless of size or revenue tied to each customer. | 5 accounts canceled, whether they paid $50 or $5,000 each. | B2B teams with high account variance |
| Gross Churn | Revenue lost before factoring in any upgrades or expansions. | Lost $5,000 from canceled plans, without counting upsells from other users. | Early-stage SaaS or investor reports |
| Net Churn | Revenue lost minus revenue gained from expansions or upgrades. | Lost $5,000 but gained $6,000 in upsells, so net churn is negative. | Growth teams and financial modeling |
Churn metrics answer different questions. Customer churn highlights user drop-off. Revenue churn reveals how money leaves the system. Logo churn counts accounts, no matter the size. Gross churn shows damage before upsells. Net churn reveals if expansion covers the loss. Each one leads to a different fix.
The right churn metric lets teams see the truth behind performance. It’s not just a loss report. It’s a mirror into the business.
How to Calculate Churn Rate SaaS
Churn rate shows how quickly customers or revenue leave your SaaS business during a set period. Without clear formulas, teams often misread the problem or miss it entirely.
Measuring churn the right way helps you spot patterns early and take action before growth slows down. Each formula gives a different view depending on your goals and billing structure.
Let’s go through the formulas you’ll need, with simple steps and examples that make them clear.
Step 1 – Use the Basic Customer Churn Rate Formula
The most common churn rate measures how many customers leave during a fixed time period. This tells you how fast your user base is shrinking. It’s the most basic version of churn and helps track user satisfaction or product fit.
Formula:
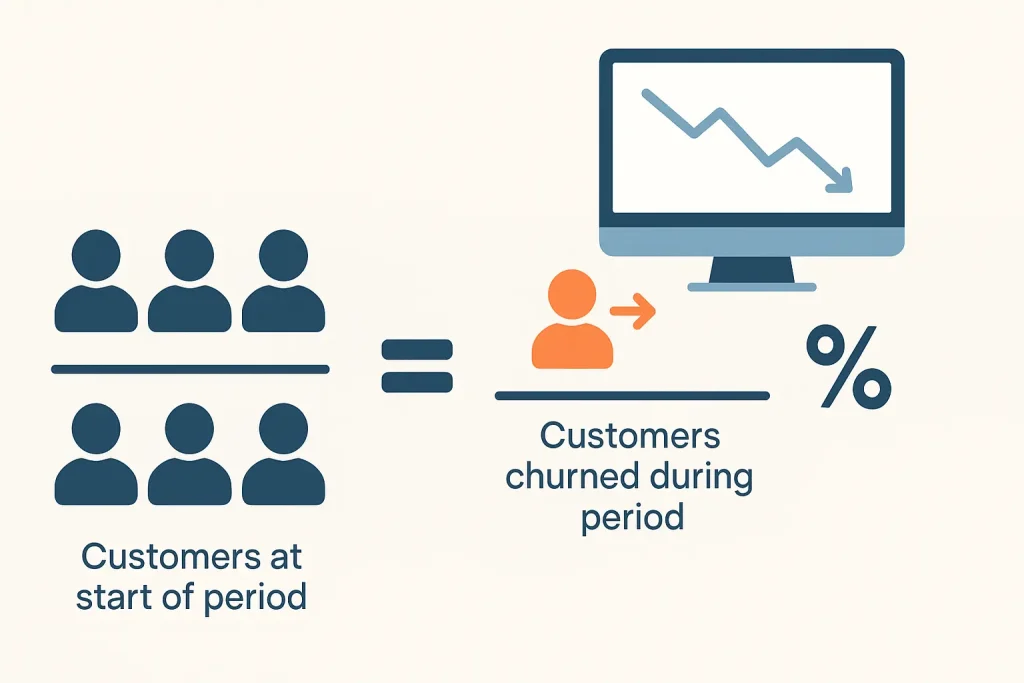
Churn Rate = (Lost Customers ÷ Starting Customers) × 100
Example:
You start the month with 200 users. By the end, 20 cancel their accounts.
Churn Rate = (20 ÷ 200) × 100 = 10% customer churn
This metric is useful when your focus is customer count rather than revenue impact. It fits teams watching retention goals or adoption drops.
Step 2 – Track Revenue Churn for MRR Loss
Revenue churn focuses on money, not people. This shows how much recurring revenue you lost from cancellations, downgrades, or non-renewals. It helps track financial health, especially in tiered pricing models or when high-paying users churn.
Formula:
Revenue Churn = (Lost MRR ÷ Starting MRR) × 100
Example:
You start the month with $10,000 in MRR. You lose $1,500 from user downgrades.
Revenue Churn = ($1,500 ÷ $10,000) × 100 = 15% revenue churn
Use this when your team reports on financial growth, expansion targets, or revenue stability.
Step 3 – Use Adjusted Churn for Fluctuating Customer Bases
Customer numbers often rise or fall within a month. Basic churn ignores this. Adjusted churn solves it by calculating the average customer count across the period. This offers a more balanced view for fast-moving teams.
Formula:
Adjusted Churn = (Lost Customers ÷ ((Start + End Customers) ÷ 2)) × 100
Example:
Start with 100 users. End with 120 users. You lost 10 during the month.
Adjusted Churn = (10 ÷ ((100 + 120) ÷ 2)) × 100 = (10 ÷ 110) × 100 = 9.1% churn
This formula works well when your base grows quickly, like during promotions or product launches.
Step 4 – Apply the Formula to a Quarterly Cycle
Some teams review churn monthly. Others need a quarterly view to see deeper trends. A longer timeframe helps smooth out short spikes or dips. The formula stays the same, but the data covers three months.
Example:
In Q1, you begin with 500 customers and lose 40 by the end.
Quarterly Churn Rate = (40 ÷ 500) × 100 = 8% churn
This view works best for B2B SaaS companies with long sales cycles or slow onboarding.
How to Choose the Right Churn Metric by Role
Different teams see churn through different lenses. What matters to a founder won’t always matter to a product manager or analyst. That’s why choosing the right churn metric depends on your role. Each metric answers a unique question about retention, revenue, or risk. Here’s how each team can track churn in a way that fits their goals.
Founders / CEOs
Founders need a clear view of customer loss and future revenue risk. Revenue churn is the best metric for them. It shows how much money is leaving and how fast. This helps gauge retention runway, burn rate, and pitch-readiness. It also supports investor decks with solid proof of customer stickiness and expansion gaps.
Growth Marketers
Growth marketers care about whether new users stick around long enough to recover acquisition costs. Revenue churn reveals how much paying value is lost, not just user count. Combine that with CAC-to-LTV ratios to see if your funnel is truly profitable. These numbers help decide which campaigns drive loyal, lasting customers.
Product Managers / UX Designers
Product teams should focus on cohort churn and feature-specific drop-offs. When users leave after using a new feature, that’s a signal to re-evaluate the experience or fit. PMs can segment churn by usage group or onboarding stage. This helps prioritize updates that keep users engaged and reduce post-trial drop-off.
Data Analysts / RevOps
Analysts and RevOps teams need deeper trends, not surface numbers. Net revenue churn shows both loss and gain, accounting for upsells and downgrades. By segmenting churn by plan, region, or behavior, they spot where risk builds up. These insights shape retention models and help prevent high-value losses early.
Support / Customer Success Teams
Support teams track churn closest to the user’s actual experience. They should monitor logo churn to see how many accounts cancel, regardless of plan size. This helps them spot patterns like failed onboarding or poor ticket response. When accounts drop suddenly, they’re often the first team to catch the cause.
What’s a Good Churn Rate? (Benchmarks to Compare Against)
Not every churn number means trouble. A 10% churn rate could be a red flag for one team, but totally normal for another. That’s why SaaS teams must compare churn against companies with similar models, growth stages, and customer types. You need the right benchmark before deciding if your churn is healthy or risky.
Let’s start with the difference between B2B and B2C churn. B2B companies often have longer contracts, which keeps churn low. In most cases, B2B churn ranges from 5% to 7% annually. On the other hand, B2C churn tends to spike higher. Consumer apps can see 8% to 12% churn every month, especially if they use monthly billing.
Next, churn changes depending on your company’s stage. Early-stage SaaS companies often see higher churn while testing product fit. Churn rates between 10% and 20% are common in the first two years. Once your product matures and retention improves, churn usually drops closer to 3% to 7% yearly.
Pricing models also affect churn. Freemium and self-serve plans attract high traffic but bring high churn. Many free users never convert or stay. These models can expect churn between 15% and 30% monthly. Enterprise pricing with sales contracts often keeps churn low, around 5% or even less per year.
You can use the table below to compare your churn rate against typical SaaS benchmarks by segment:
|
SaaS Model or Stage |
Typical Churn Rate |
|
B2B SaaS |
5% to 7% annually |
|
B2C SaaS |
8% to 12% monthly |
|
Early-Stage SaaS |
10% to 20% annually |
|
Mature SaaS |
3% to 7% annually |
|
Freemium / Self-Serve |
15% to 30% monthly |
| Enterprise / Contract |
Under 5% annually |
Common Mistakes in Calculating SaaS Churn
Churn mistakes happen fast, but small errors can mislead entire teams and throw off real insights. Below are the most common calculation errors you should avoid.
- Not segmenting voluntary and involuntary churn hides the difference between user exits and payment failures.
- Trial users should never be counted as churned since they were not paying customers to begin with.
- Upgrades and downgrades must be included to reflect real revenue movement, not just customer loss.
- Churn reports lose clarity when teams mix monthly data with rolling time frames in the same view.
- The churn period should always begin from the first billing date, not from the initial sign-up.
- High-value clients and small accounts should not carry the same weight in churn analysis.
- Teams lose key insights when churn is not segmented by plan tier, user type, or customer region.
How to Reduce Churn in SaaS
Churn reduction starts with small fixes, then grows into a deeper strategy as your business matures. The best tactic depends on which churn stage you’re in and what type of users you’re losing.
Below are proven actions, organized by short-term, mid-term, and long-term goals that fit real SaaS operations.
Short-Term: Quick Wins That Improve Retention Fast
Better onboarding always comes first. Most churn happens in the first seven days after sign-up or payment. Use guided steps, in-app checklists, and a short welcome sequence to build trust from the start.
In-app nudges work well for re-engaging silent users. Push reminders or feature tips right before drop-off points. Tie that with live chat or CS prompts to make users feel supported before they leave.
Identify early churn risks by tagging customer behavior in your product. Drop-offs after onboarding steps, skipped features, or low session counts all signal a need for intervention early on.
Mid-Term: Segment and Respond with Smarter Targeting
Not all churn comes from the same place. Separate users by plan, acquisition source, or activation rate. A user from a paid ad who drops fast may need a different fix than a loyal free-tier user.
Use churn segments to trigger automated CS follow-up or survey outreach. Add real-time feedback prompts based on plan type or usage stage. This helps your team personalize retention efforts without guesswork.
Find where churn happens most often, then build use-case-specific flows to prevent it. If users drop before a certain milestone, guide them with focused content or product prompts that push them past that point.
Long-Term: Build Loyalty Through Value and Expansion
Create value paths beyond just stopping churn. Add upgrade nudges when users reach plan limits or explore premium tools. Let success unlock expansion.
Use loyalty triggers like credits, milestone rewards, or longer-term billing discounts. These help shift the mindset from canceling to committing. Over time, users start to see your product as part of their daily work.
Frequently Asked Questions(FAQs)
After setting up your metrics and strategy, a few real-world doubts usually remain. These answers cover what SaaS teams often ask when trying to improve how they track, explain, or reduce churn.
How often should I calculate my churn rate?
Many experts recommend matching your churn calculation interval to your billing or renewal cycle. Monthly reviews work for short‑cycle products, while long‑term contracts may be better tracked quarterly.
What is involuntary churn, and why does it matter?
Involuntary churn occurs when customers leave due to payment failure or account issues, not dissatisfaction. Tracking involuntary churn helps pinpoint process problems rather than product fit issues.
Can a large customer loss distort my churn metrics?
Yes. Losing one enterprise client can heavily skew revenue churn, especially in early-stage SaaS. That’s why it’s smart to track both customer count churn and revenue churn side by side for better balance and clarity.
Does the benchmark for a “good” churn rate differ by company size?
It does. Smaller SaaS companies often see churn between 10% and 20% annually, especially when product-market fit is still forming. Mature companies with stable contracts aim for churn below 5% as a healthy long-term benchmark.
Is there a simpler way to understand churn’s impact on business?
Churn directly affects customer lifetime value. A higher churn rate shortens customer lifespan, which raises acquisition costs. Lowering churn extends lifetime value and improves ROI on sales and marketing spend across the funnel.
Own Your Churn Numbers, Own Your Growth
Churn isn’t just about loss. It’s a signal. It reflects what’s working, what’s fading, and what still needs attention inside your product experience. For SaaS teams focused on retention, churn becomes more than a metric. It becomes the sharpest mirror in the room.
When you track it clearly and break it down by user behavior, pricing tier, or timing, churn starts to tell a story. From there, the work shifts. Segment it. Respond to it. Use it to strengthen what matters most.
If now feels like the right time, try using a churn calculator or downloadable audit worksheet. It could be the starting point toward better retention, stronger metrics, and a growth strategy that actually holds.